Economic Data Interpretation: A Guide for Investors
June 5, 2024
Economic data interpretation is crucial for investors aiming to navigate the complexities of the market and identify investment opportunities. This data, which includes GDP growth rates, inflation figures, and employment reports, serves as a critical indicator of a country’s economic health and performance. Accurately interpreting these statistics can provide essential insights, guide investment decisions, and help investors maintain a competitive edge.
Understanding the Importance of Economic Data Interpretation
Economic data interpretation is essential for investors navigating the complex market environment. Indicators such as GDP growth rates, inflation figures, and employment reports are crucial in assessing the overall health and performance of an economy. Accurately interpreting these figures provides essential insights that guide investment decisions and help investors stay competitive.
For instance, if an investor notices an increase in consumer spending, this could signal a robust economy, presenting a favorable opportunity to invest in consumer-oriented companies. Such strategic decisions could lead to substantial returns if market demand continues to rise.
However, economic data alone may not fully predict market movements due to factors like market sentiment and geopolitical events. It is thus vital for investors to complement economic data with other analytical tools like financial statements and market analyses. This comprehensive approach can lead to better-informed decisions, reducing reliance on any single data source.
In essence, understanding economic data is crucial for making informed investment choices. It enables investors to spot potential opportunities and assess risks, enhancing their ability to navigate through economic complexities effectively.
Types of Economic Data
Understanding different types of economic data is crucial for investors aiming to make informed decisions. This data offers insights into the health and performance of an economy, assisting in assessing market conditions, identifying trends, and forecasting future changes.
Gross Domestic Product (GDP) is a key type of economic data. It measures the total value of all goods and services produced within a country over a specific period, providing a snapshot of the economy’s size and growth rate. A steadily increasing GDP indicates a growing economy, which could present lucrative investment opportunities. Conversely, a declining or stagnant GDP suggests economic difficulties, warranting a more cautious investment approach.
Inflation indicators are also vital. Inflation, the rate at which the general level of prices for goods and services rises, impacts purchasing power. Governments and central banks monitor inflation to adjust interest rates and monetary policies accordingly. For investors, understanding inflation is essential as it affects investment returns, particularly for fixed-income investments like bonds.
However, relying solely on GDP and inflation may not offer a complete economic picture. For example, GDP doesn’t account for income inequality or environmental impacts. Similarly, inflation data might not reflect sector-specific price changes that significantly affect certain industries. Thus, investors should consider a diverse array of economic data, including employment statistics, consumer confidence levels, trade data, and sector-specific information. This comprehensive approach ensures a nuanced understanding of both macroeconomic conditions and microeconomic factors within specific industries.
As an investor, being knowledgeable about these various types of economic data and their implications allows for a more precise economic assessment and more strategic investment decisions. Next, we will discuss reliable sources of economic data to ensure you have access to accurate and timely information for your investment analysis.
Techniques for Analyzing and Interpreting Economic Data
Investors utilize various techniques to analyze and interpret economic data effectively, aiding in decision-making and future market trend predictions. Mastery of these techniques is crucial for navigating the complexities of the economic landscape, whether you’re an experienced investor or a newcomer.
Trend Analysis: This technique involves reviewing historical data to identify patterns that predict future behavior. For instance, a consistent rise in GDP growth over several quarters may signal ongoing economic expansion, while a decline in consumer spending might indicate a forthcoming economic downturn. Identifying these trends allows investors to tailor their strategies appropriately.
Regression Analysis: This statistical approach helps determine the relationship between different variables. For example, analyzing the correlation between housing prices and interest rates might reveal that higher interest rates typically reduce housing prices, indicating potential issues within the real estate market. Through regression analysis, investors can establish quantitative links between variables, enhancing prediction accuracy.
However, relying solely on quantitative methods such as trend and regression analysis may not provide a complete picture. Economic trends are influenced by a mix of social, political, and environmental factors. For example, robust economic indicators might be overshadowed by social unrest or political instability, which could undermine economic stability.
Qualitative Analysis: For a more rounded analysis, qualitative factors must be considered. For instance, a country heavily reliant on tourism might show strong economic indicators. Yet, political instability or health crises could deter tourists, significantly impacting the economy. Qualitative methods, including news monitoring and surveys, can offer insights into potential risks not apparent from quantitative data alone.
In conclusion, effective economic data analysis resembles solving a puzzle where both quantitative and qualitative pieces are necessary. By integrating these diverse techniques, investors can gain a comprehensive understanding of economic conditions, leading to more informed investment decisions.
Importance of Data Visualization in Economic Analysis
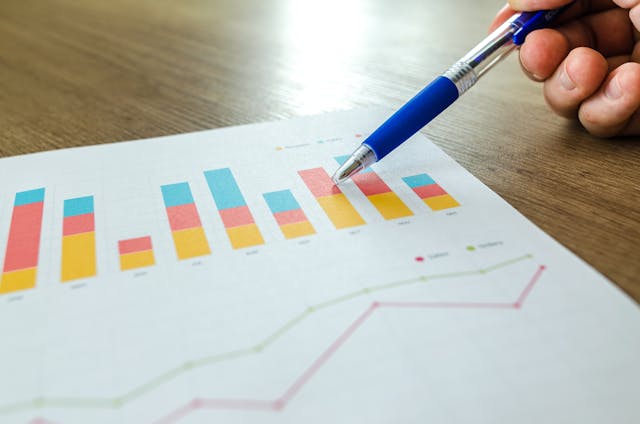
Data visualization is critical in economic analysis, helping to simplify and interpret complex datasets effectively. This method transforms numerical economic data into visual formats like charts and graphs, making it easier to identify trends, patterns, and correlations.
Example of Data Visualization in Action: Consider an investor analyzing two tech companies. Instead of combing through dense financial reports, data visualization tools can graphically compare key performance indicators like revenue and profit margins. This visual approach speeds up analysis and enhances decision-making, providing a clear picture of each company’s financial health and growth prospects.
Benefits Beyond Comparisons: Data visualization goes further than making simple comparisons. It can reveal hidden patterns and insights that are not apparent in raw data. For example, plotting GDP growth rates over time on a line graph allows investors to quickly identify economic booms and recessions, providing a historical context that aids in forecasting future market conditions.
Advantages of Visual Processing: Humans process visual information faster than text, which makes data visualization particularly powerful. Visuals can be understood and shared across teams, enhancing collaboration and decision-making among analysts of varying expertise levels.
Visuals as Navigational Tools: Think of data visualization as a GPS for economic analysis, guiding users through complex information landscapes to reach clear conclusions. This tool provides direct visual cues that lead to better insights and actionable decisions, much like how GPS provides route guidance.
In summary, data visualization is indispensable for modern economic analysis, offering a way to navigate large amounts of data efficiently. It not only improves understanding and decision-making but also gives analysts a competitive edge by enabling quicker and more accurate interpretations of economic conditions.
Identifying Trends in Economic Data
Identifying trends in economic data is essential for investors and analysts to understand the economy’s health and make informed decisions. This involves analyzing historical data to spot patterns and predict future trends.
Analyzing Historical Data: One effective method is to examine past economic indicators. For example, a consistent increase in housing prices over time suggests a positive trend in real estate, providing valuable insights for potential investment opportunities.
Using Moving Averages: Moving averages smooth out short-term fluctuations and highlight longer-term trends. Calculating a moving average for indicators like unemployment rates can show their overall direction, aiding in understanding labor market conditions.
Complexities in Trend Identification: Identifying trends isn’t always straightforward. Economic cycles, government policies, and global events can complicate data analysis, introducing anomalies that may mask the true trends. It’s crucial to use caution and multiple indicators to draw reliable conclusions.
Analogy with Weather Forecasting: Just as meteorologists use various data points to forecast weather, economic analysts use indicators such as GDP growth, inflation rates, and employment figures to predict economic trends. However, like weather patterns, economic trends can shift unexpectedly due to unforeseen events.
Start Your Free Trial: Dive into Data Analysis Today!
Immerse yourself in the world of economic data interpretation and investment strategy by joining our webcasts at Rosenberg Research. Gain exclusive access to thought-provoking discussions with industry experts and thought leaders, where we delve deep into the nuances of economic trends and their implications for investors.
Whether you’re a seasoned investor or just starting out, our webcasts provide invaluable insights to help you navigate the ever-changing landscape of financial markets. Stay informed, ask questions, and elevate your investment approach by joining our community of like-minded individuals committed to staying ahead of the curve.
Sign up today and embark on a journey of knowledge and discovery with Rosenberg Research.
Rosenberg Research ©2024 All Rights are Reserved


